We have gathered these digital product design stats from various reputable platforms to provide you with a comprehensive overview of the current landscape. These insights offer valuable data on trends, user behavior, industry growth, and the impact of design on business outcomes, helping to inform and guide your design strategies.
Digital Product Design Stats
The volume of digital product transactions has increased by almost 70% in the last 2 years.
Conservative estimates place spending on digital products at $135 billion for 2024.
Digital products accounted for 3% of US consumer spending in 2023.
Global spending on digital goods is expected to hit $135 billion by 2024.
Daily active users of digital products surged by 54% between January 2020 and August 2021.
In 2020 alone, 2 billion consumers purchased digital products.
Products advertised with an importance on their unique selling proposition (USP) outsell competitors by 35%.
Digital product design with consistent branding across all platforms increases brand loyalty by 60%.
Mobile apps prioritizing proportion in their design have higher user retention rates.
The Digital Media market is projected to experience rapid growth, with an estimated revenue of $560.70 billion in 2024.
Digital Product Design Stats in User Experience (UX)
88% of online consumers are less likely to return to a site after a bad experience.
70% of online businesses that fail do so because of bad usability.
Good UX design can raise conversion rates by up to 400%.
94% of first impressions of a website are design-related.
Users form an opinion about your website in 50 milliseconds (0.05 seconds).
74% of people are likely to return to a website if it's mobile-friendly.
A seamless UX can increase customer satisfaction by 16%.
UX testing can reduce development time by 33-50%.
85% of adults think that a company’s mobile website should be as good or better than its desktop website.
Every $1 invested in UX yields a return of $100 (ROI = 9,900%).
Digital Product Design Stats in User Interface (UI)
38% of people will stop engaging with a website if the content/layout is unattractive.
52% of users say that the main reason why they won’t return to a website is aesthetics.
Using large images, animations, and other visuals increases the likelihood of content being remembered by 65%.
Simplified user interfaces increase user engagement by up to 60%.
Users typically read only 20% of the text on a web page.
53% of mobile site visits are abandoned if pages take longer than 3 seconds to load.
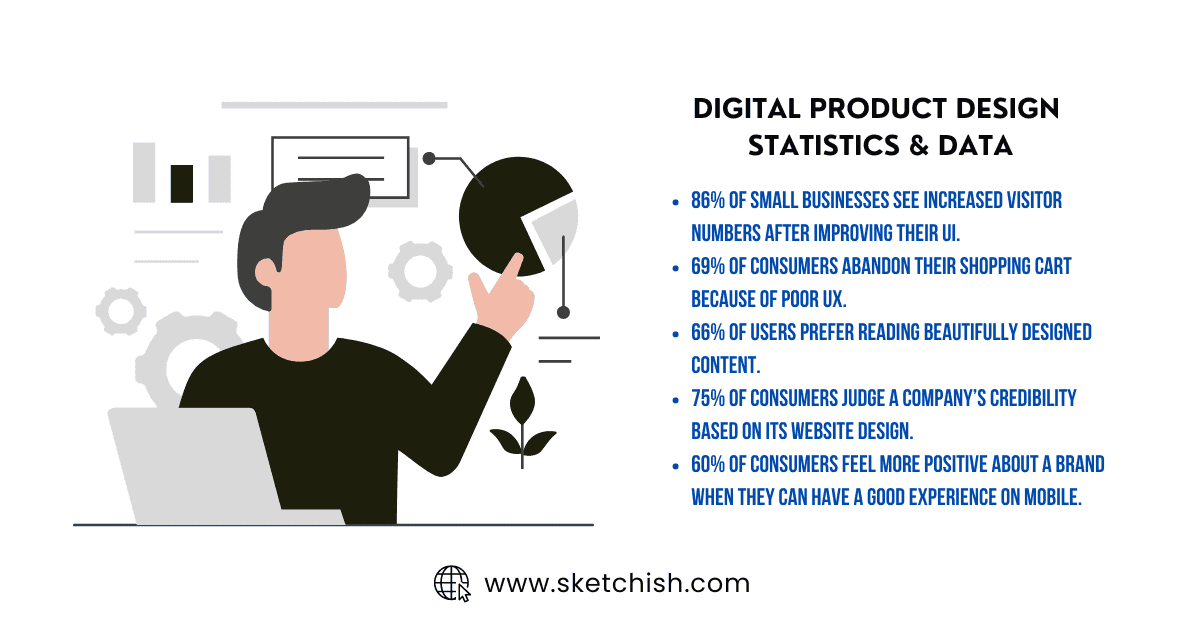
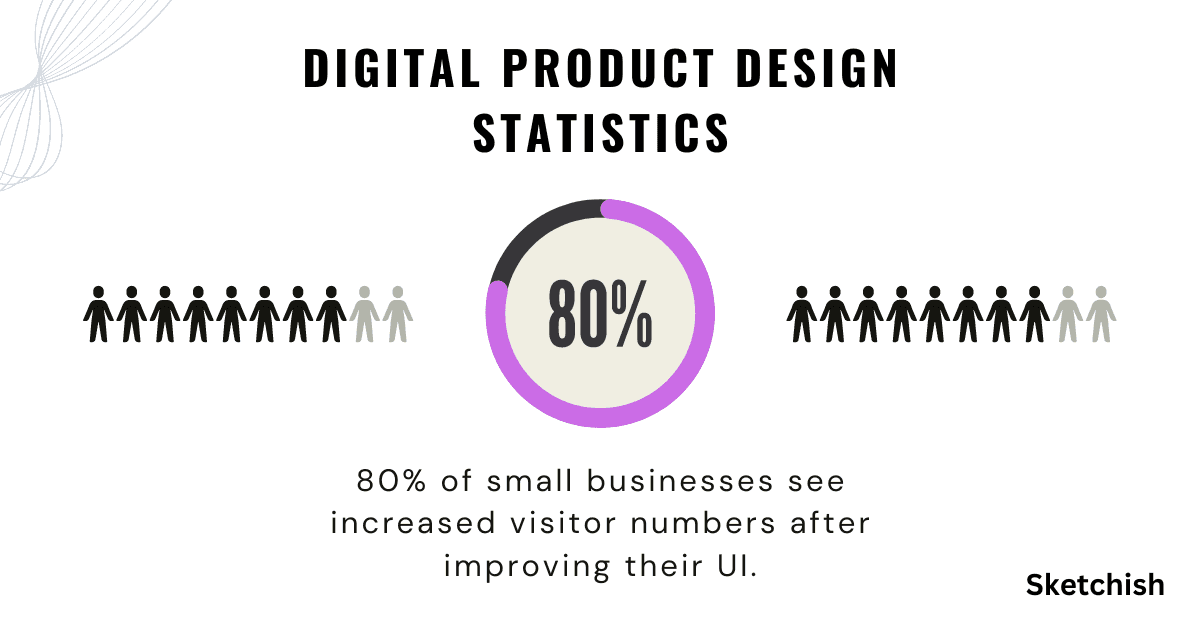
86% of small businesses see increased visitor numbers after improving their UI.
46% of users say they won’t revisit poorly performing websites.
83% of respondents said a seamless experience across all devices is very important.
48% of users feel frustrated and annoyed when websites are not mobile-friendly.
Digital Product Design Stats in Mobile Design
Mobile devices account for approximately half of web traffic worldwide.
57% of users say they won’t recommend a business with a poorly designed mobile site.
89% of people are likely to recommend a brand after a positive experience on mobile.
60% of consumers feel more positive about a brand when they can have a good experience on mobile.
68% of companies have integrated mobile marketing into their overall marketing strategy.
Mobile apps have a retention rate that is 4 times higher than mobile web.
53% of smartphone users prefer mobile apps over mobile websites.
21% of millennials open an app 50+ times per day.
90% of mobile time is spent in apps.
80% of the top websites are mobile friendly.
Digital Product Design Stats in Web Design
48% of people cited a website’s design as the number one factor in deciding the credibility of a business.
75% of consumers judge a company’s credibility based on its website design.
Websites with a video on their landing page increase conversions by 80%.
Users spend 88% more time on a website that has video.
47% of website visitors check out a company’s products/services page before looking at any other sections of the site.
44% of website visitors will leave a company’s website if there’s no contact information or phone number.
62% of companies that designed a website specifically for mobile had increased sales.
40% of people will leave a website if it takes more than 3 seconds to load.
The average user spends 88% more time on a website with a blog.
Websites with a loading time of 2 seconds have an average bounce rate of 9%, while websites with a loading time of 5 seconds see bounce rates increase to 38%.
Overall Digital Product Performance
Personalized UX can lift conversion rates by 8%.
Customer-centric companies are 60% more profitable than companies that are not.
68% of users leave a website because of poor UX.
A one-second delay in mobile load times can impact mobile conversions by up to 20%.
67% of mobile users are more likely to buy from a mobile-friendly site.
75% of online customers expect assistance within 5 minutes.
61% of users are unlikely to return to a mobile site if they had trouble accessing it, and 40% visit a competitor’s site instead.
51% of users say they use mobile devices to discover new brands and products.
Companies that prioritize UX design see a 37% decrease in support costs.
93% of people have left a website because it didn’t display properly on their device.
Customer Behavior with Digital Product Design
70% of customers abandon purchases because of bad user experiences.
81% of users have a less favorable view of a company after experiencing poor customer service.
77% of users think less of a company if their website is not optimized for mobile.
64% of users want to see product/service information on a company’s homepage.
74% of people will return to a website if it’s optimized for mobile.
39% of people will stop engaging with a website if images won’t load or take too long to load.
90% of users report that they stopped using an app due to poor performance.
Users are 4 times more likely to switch to a competitor if they experience service-related issues.
48% of people cited that a website’s design is the number one factor in determining the credibility of a business.
38% of people will stop engaging with a website if the layout/content is unattractive.
Digital Product Design Stats in E-commerce
69% of consumers abandon their shopping cart because of poor UX.
53% of mobile users leave a site if it takes longer than three seconds to load.
64% of consumers purchase after watching branded social videos.
73% of people are more likely to purchase after watching a product video.
Adding videos to your product pages can increase conversions by 80%.
46% of consumers say they won't purchase from a brand again if they had an interruptive mobile experience.
75% of consumers admit to making judgments on a company’s credibility based on their website’s design.
E-commerce sales grow by 2.2% for every 1-second improvement in page load time.
66% of users prefer reading beautifully designed content.
79% of consumers who are dissatisfied with website performance are less likely to buy from the same site again.
Digital Product Design Stats in SEO and Accessibility
75% of users never scroll past the first page of search results.
Sites on the first page of Google search results have an average load time of less than 200 milliseconds.
57% of all online traffic comes from mobile devices.
Websites that load in 5 seconds see 70% longer average sessions.
Improving accessibility for visually impaired users can increase traffic by 10-15%.
Accessible websites reach a 13% larger audience.
80% of users will click away from a website if it’s not accessible.
Websites with structured data have a 20-30% higher click-through rate.
61% of marketers say improving SEO and growing their organic presence is their top inbound marketing priority.
94% of B2B buyers say they perform online research before making a purchase decision.
Digital Product Design Stats in Brand Perception
59% of consumers prefer to buy from familiar brands.
Consistent brand presentation across all platforms increases revenue by up to 23%.
64% of consumers have a positive perception of brands that offer digital experiences tailored to their preferences.
80% of consumers are more likely to purchase a brand that provides personalized experiences.
70% of consumers say they have already purchased as a result of seeing a social media post.
71% of consumers feel frustrated when a shopping experience is impersonal.
86% of consumers say authenticity is important when deciding what brands they like and support.
73% of consumers love a brand because of helpful customer service.
90% of consumers expect consistent interactions across channels.
45% of users will unfollow a brand on social media if their platform is dominated by self-promotion.
Tips to Improve your own digital products based on these statistics
Prioritize user experience (UX) and user interface (UI) design. Understand your target audience, their needs, and pain points.
Conduct user research, usability testing, and gather feedback to iterate on your designs.
Implement responsive design to ensure a seamless experience across different devices.
Focus on touch-friendly interactions, load times, and mobile-first design principles.
Maintain consistent branding across all platforms (website, app, social media).
Use clear language, concise copy, and straightforward navigation.
Follow WCAG guidelines for color contrast, keyboard navigation, and screen reader compatibility.
Compress images, minify code, and leverage content delivery networks (CDNs).
Use A/B testing to compare different design variations and choose the most effective one.
Involve cross-functional teams (designers, developers, marketers) in the design process.
If these statistics have sparked your interest in enhancing your digital products, our expert design team is here to help. We specialize in creating intuitive, user-centered designs that drive engagement and success. Contact us today to learn more about our digital product design services and how we can collaborate to enhance your digital presence.
Share on: